
Social Vulnerability Index
and Other Related Maps and Data
Data and Tools to Advance Equity
The Resilience Office works to advance islandwide resilience to the challenges of climate change. This work requires us to confront existing social and racial inequities, to critically analyze the potential for disparate impacts of climate change on frontline communities, and to intentionally design our policy solutions and program responses to advance climate resilience and equity for all communities.
The Social Vulnerability Indexes and the ALICE Report findings below are just a first step in understanding which communities may be more or less vulnerable. Different data and metrics could be more or less important depending on the situation. Our work requires us to layer these measures with climate change impacts, such as extreme heat, flooding, and sea-level rise. The Climate Ready O‘ahu mapping tool helps us to see the communities that may confront compounded socioeconomic and climate-related challenges.

CDC's Social Vulnerability Index 2016
The Centers for Disease Control and Prevention Social Vulnerability Index (CDC SVI), using U.S. Census data, ranks areas on 15 social factors, including income, access to transportation, and disability status, and groups them into four related themes: Socioeconomic Status, Household Composition & Disability, Minority Status & Language, and Housing & Transportation. The CDC SVI 2016 for the City and County of Honolulu shows mapping for both the overall SVI as well as each SVI theme.
O‘ahu Social Vulnerability Index (SOVI)
A customized index of social vulnerability (SOVI, Socioeconomic Vulnerability Index) was developed for O‘ahu for the development of the Resilience Strategy. The SOVI for O‘ahu has identified particular community characteristics that increase vulnerability to Tsunamis, Hurricanes, Flooding and Sea Level Rise. The maps and data developed for the SOVI identify the geographic areas that are most vulnerable, as well as the main socioeconomic drivers of vulnerability. Targeting actions to the most vulnerable communities and populations will assist in increasing adaptive capacity in the event of a hazard, and will yield long-term resilience benefits for O‘ahu as a whole. Learn more about the O‘ahu SOVI’s development process, methodology, and context in this O‘ahu SOVI Construction presentation.


Map of ALICE and Poverty Data by ZIP Code for the Island of O'ahu
Aloha United Way ALICE® 2020 Report
United Way ALICE Project & Interactive Map: Hawai'i State
To View O‘ahu, click County Profiles and select Honolulu from the dropdown menu.
Aloha United Way 2018 ALICE Honolulu County Profile
Aloha United Way periodically releases a financial hardship report called ALICE®: A Study in Financial Hardship in Hawaii, often called the "ALICE Report." ALICE is an acronym for Asset Limited, Income Constrained, Employed — households that earn more than the Federal Poverty Level, but less than the basic cost of living for the county (the ALICE Threshold). While conditions have improved for some households, many continue to struggle, especially as wages fail to keep pace with the cost of household essentials (housing, child care, food, transportation, health care, and a basic smartphone plan).
The AUW ALICE 2020 Report's main findings for the State of Hawai'i are: (1) The cost of living is increasing for ALICE households. (2) Worker vulnerability is increasing while wages stagnate in ALICE jobs. (3) The number of ALICE households has increased in Hawai‘i as a result of rising costs and stagnant wages.

Intersections of Climate Change Impacts
Socioeconomic and demographic data, such as Social Vulnerable Indexes and ALICE population data, help us understand which communities are likely to be especially at risk to shocks such as hurricanes and other climate change hazards.
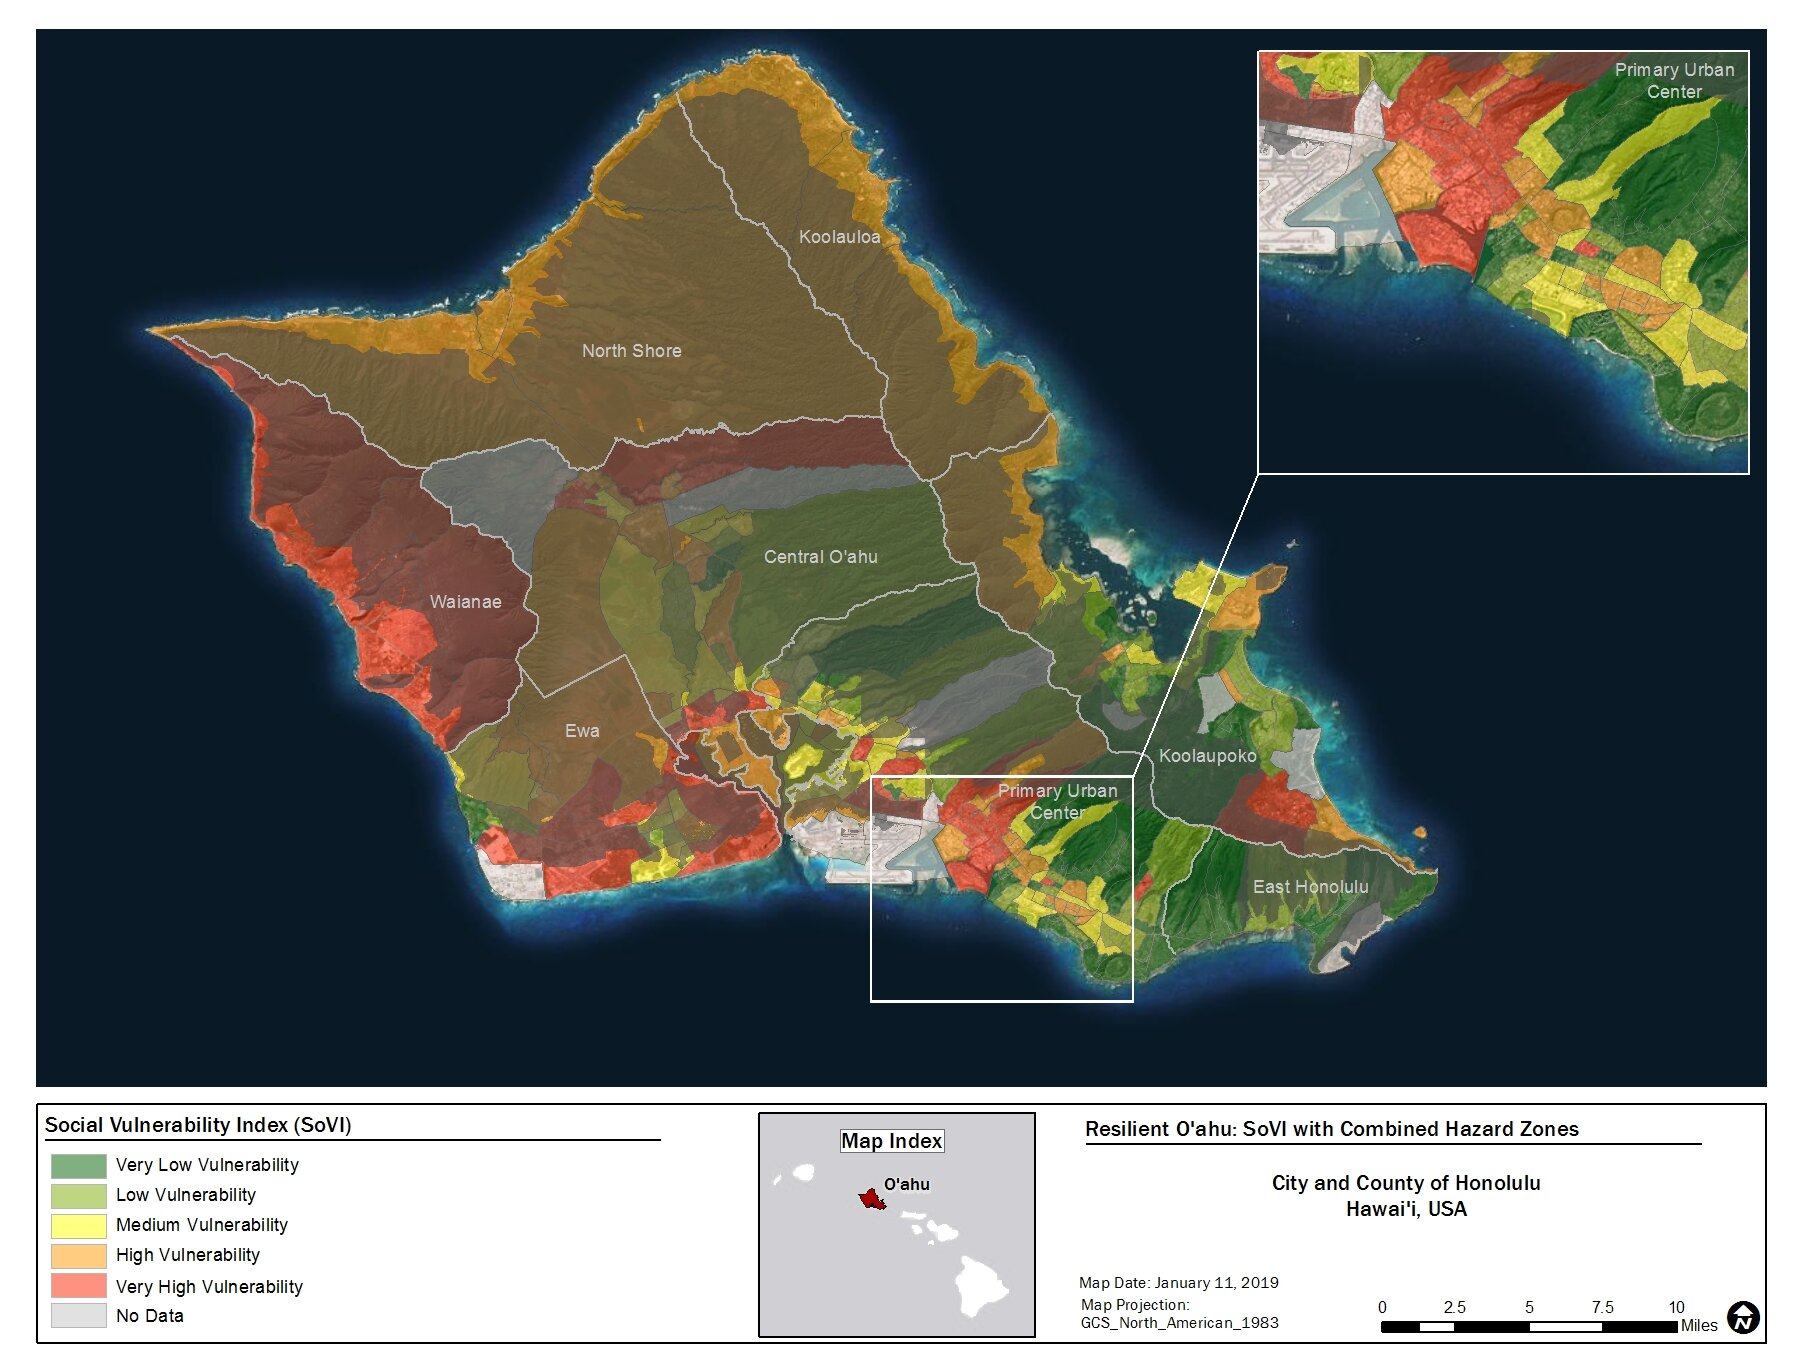
Combined Maps of Social Vulnerability and Climate Change
Along with the customized O‘ahu SOVI that was developed to inform the Resilience Strategy, below are maps and data developed for the SOVI to identify particular community characteristics that increase vulnerability to Tsunamis, Hurricanes, Flooding and Sea Level Rise. Actions targeting the most vulnerable communities and populations will assist in increasing adaptive capacity in the event of a hazard, and will yield long-term resilience benefits for O‘ahu as a whole.
View the overlays of SOVI and several combined hazards (SOVI and All Hazards), as well as the overlay with flooding (SOVI Flood), hurricanes (SOVI Hurricane), sea-level rise (SOVI SLR), and tsunamis (SOVI Tsunami).
Heat, Flooding, and Sea-Level Rise Maps
The Climate Ready O‘ahu mapping tool presents multiple climate change stressors using the best available science, showing for example, which areas or structures are at risk from flooding, extreme heat, or sea level rise. It also includes regulatory layers, such as Community Plan Areas and the Flood Insurance Rate Map.
